Released! Walk through Rescale's New User Interface

In the previous article, I had briefly discussed the three features that would debut with the new user interface. Today, I would like to walk you through the entire job-setup process using the new UI. But before I do that, here’s a list of new features for you to skim over.
- Job type visualization
- Every job type on the platform is now visualized and its setup process is divided into multiple steps.
- You can jump around different steps by clicking one of the icons in the visualized model, and review the summary of your job settings before submission.
- Core-to-Instance mapping
- The new hardware settings page provides a visual aid to help users identify the number of cores available for each instance.
- Improved Transfer Experience
- The new platform now supports transferring multiple files simultaneously, utilizing your bandwidth as much as possible.
- Better License Selection Experience
- You are given a simple set of options to choose from for software licenses, and you can choose the best option for each job.
- Job sharing with a message
- You can share your jobs with a customized message.
- Improved overall experience
- The entire platform behaves more like a desktop application, with every action followed by a quicker response.
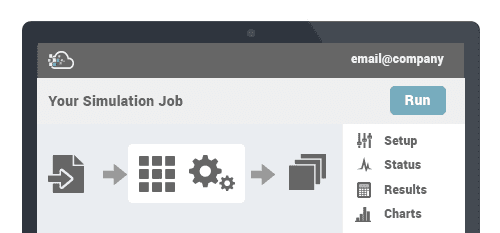
Let’s set up a job by clicking on + New Job on the navigation bar.
![]()
In the previous UI, the requirements for setting up a simulation had not been laid out as clearly, but with the new UI, you’re given a set of specific steps that you must go through.
As you can see, there are three parts for setting up a basic job – Input File(s), Software, and Hardware. There’s also Post Processing as the last step, but as it is indicated in the UI, it is optional. However, it is important to note that a user can navigate through different steps without entering valid information for each one. In other words, you can fill things out in any different order.
To move around, there are three different UI elements that you can use. First, you can use the Next and the Back buttons placed at the bottom of each page. Second, you can use the navigation elements on the right sidebar – clicking either the arrows or the names of the steps will take you to a different step. Lastly, you can navigate through different steps by clicking on one of the icons on job visualization.
To set up a job, it is recommended that you upload your input files first, even before you select your software. The dropdown menu for selecting an existing file(s) has not changed, but the progress of your transfer is now displayed on the navigation bar. As before, you can select either Basic or Enhanced for transfer methods.
In Software Settings page, you should select the software of your choice. In the new UI, you see more software in one page, thereby reducing the need for scrolling, and for each software we’ve included links to the tutorials that could help you set up your job. The command for the software must also be defined here.
In the new Hardware Settings page, you get a table of available core types so you can compare their specification more easily. Also on the right, you have the visualization for node to core type mapping and the availability of the Low Priority pricing option.
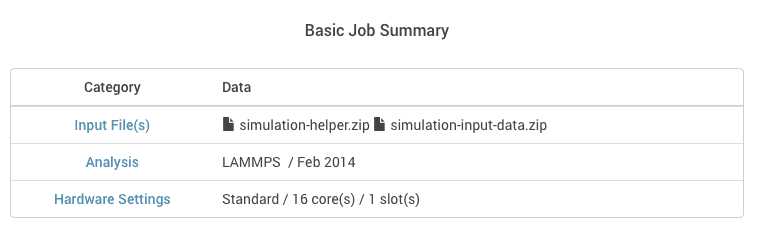
Finally on the review page, you get a summary of your setup, and you can decide whether to save or submit your job.
And that’s it! Here’s what the new “Status” page looks like for a submitted LAMMPS job that is executing.
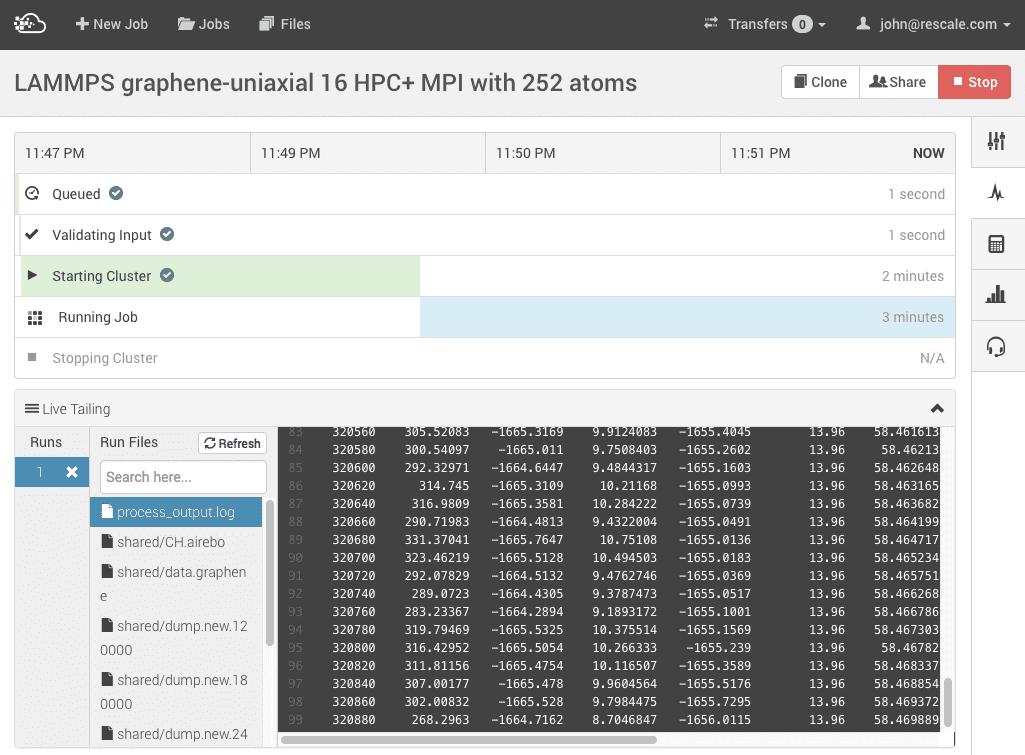
First of all, notice that the sidebar menu has been collapsed to provide more space to the content. At the top of the status page is the list of steps that a submitted job has to go through, and there’s also a Gantt chart that shows how long each step takes.
Under the Gantt chart is the Live Tailing window, which behaves the same way except for its full-screen mode. In the new UI, the full-screen mode actually takes up the entire browser for easier file viewing. The rest of the UI elements should be familiar, as they were taken from the older user interface version.
When the job finishes running, the Results page is where you can see your all your output files. As before, you can view smaller files within the browser and download or remove specific files. Or if you’ve run a Design of Experiments (DOE) job, you can plot your data using the Charts page.
If you’re having trouble getting the right result or setting up your job, you can share your job with support. You can also add a message to explain your problems so that we may better understand your situation.
I hope this article serves as a good introduction to our new UI, and feel free to reach out to us if you have any comments or questions about our platform.