
Too Hot? Too Cold?

Within offices, there is a constant struggle between turning the air conditioner on or off, as well as raising or lowering the thermostat’s temperature. This makes some too warm, while others put on additional layers of clothing just to maintain their warmth. This battle over the thermostat rages on even as the seasons change!
We will make Rescale our sample environment and take the initiative to explore the flow of our office’s airflow and temperature distribution. In particular, the goal is to identify a simple and easy way to implement a configuration that will make most people in the office happy and end the manual “tug-of-war”!
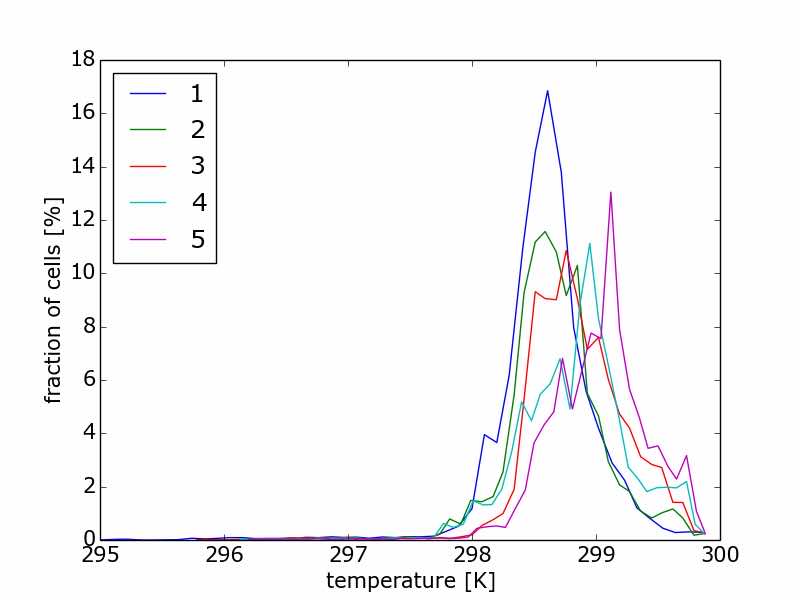
For those only looking for the conclusion, Figure 1 below shows the distribution of temperature for the five different air conditioning configurations. The resolution to this problem may be to try case 2 or 3. For those interested in how this conclusion is reached, read on.
Cloud Solution
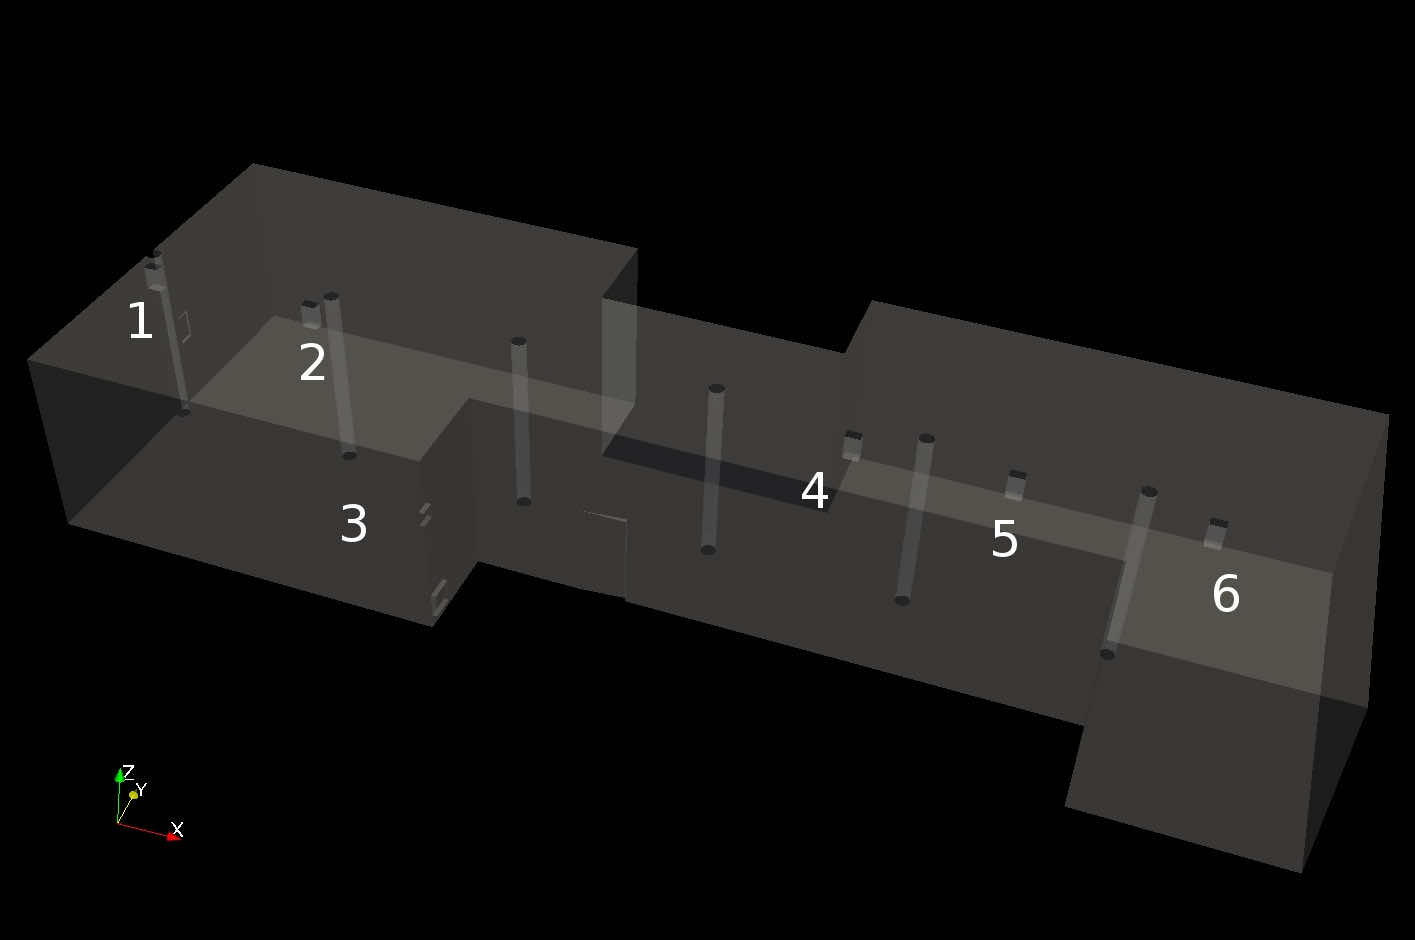
The Rescale office has six vents and each vent can be completely closed or opened–or positioned in any state in between. It is also possible to change temperature as well as to vent out air to the outside. We limit this vast combination of states by fixing the temperature to a constant and only varying the vent flow velocity to 0.1 m/s or 1 m/s. We will leverage the design of experiment (DOE) capability of Rescale to explore the solution space. Creating your own six vent flow velocity variable will create 64 (26) runs. We can rule out most cases, including all vents flowing at 0.1 m/s and those having a skewed condition, such as the first three vents having a low velocity and rest of the vents having a high velocity. The five chosen cases are shown in the table below.
[table class=”table table-striped”]
Case/Vent,1,2,3,4,5,6
1,1,1,1,1,1,1
2,1,1,0.1,1,1,1
3,1,1,0.1,0.1,1,1
4,0.1,1,0.1,1,1,1
5,0.1,1,0.1,0.1,1,1
[/table]
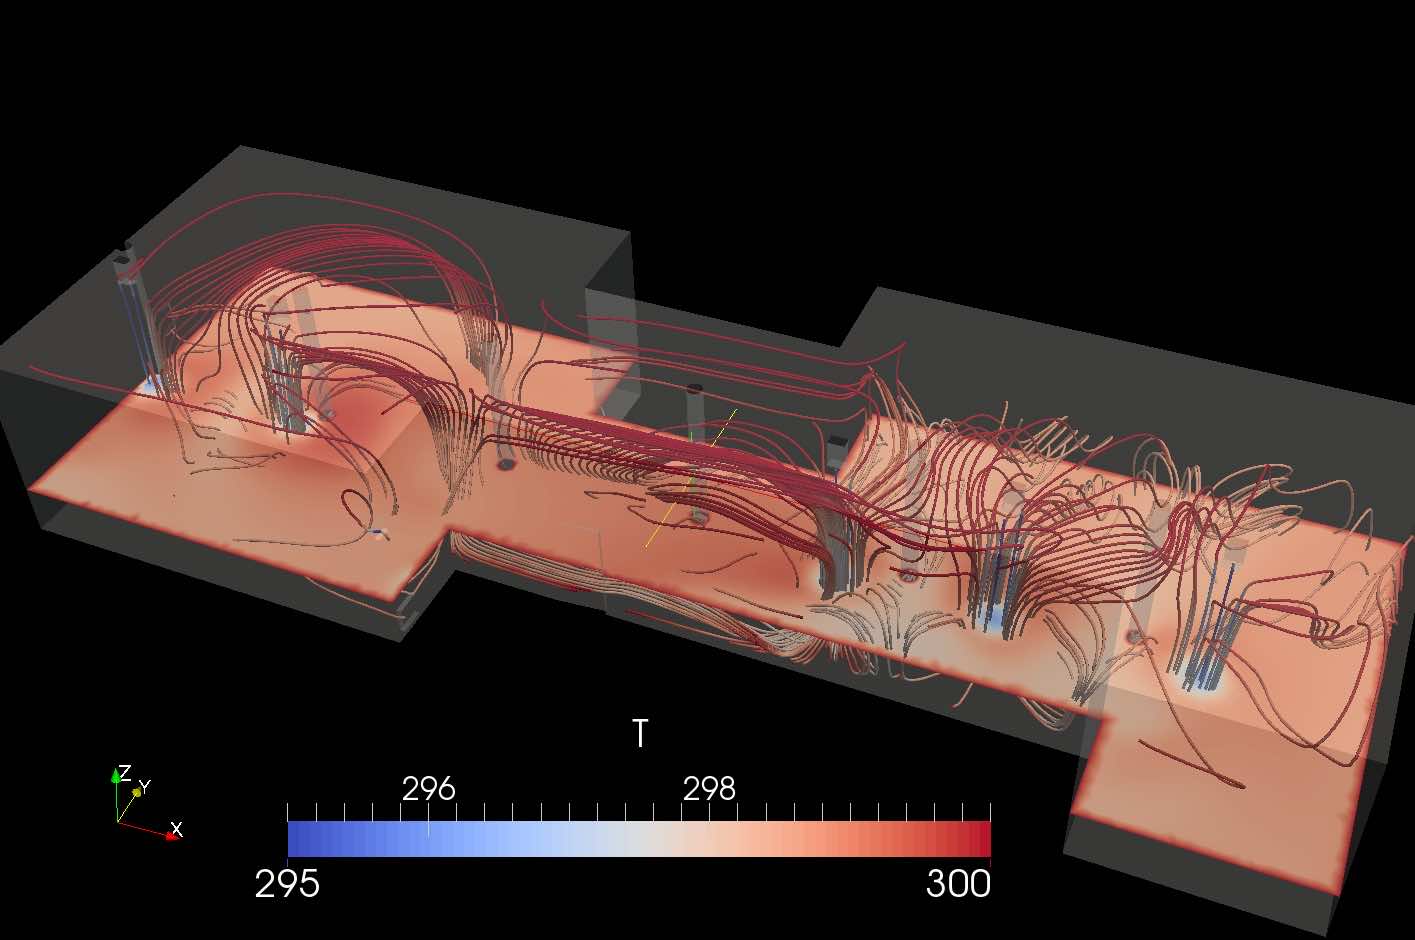
The analysis was done using OpenFOAM 2.3 and each run took 40 minutes on 8 cores. To complete the run faster, two slots (parallel executions) were used; all five runs took 2 hours to complete. The rest of the figures are the solutions for each of the five cases.


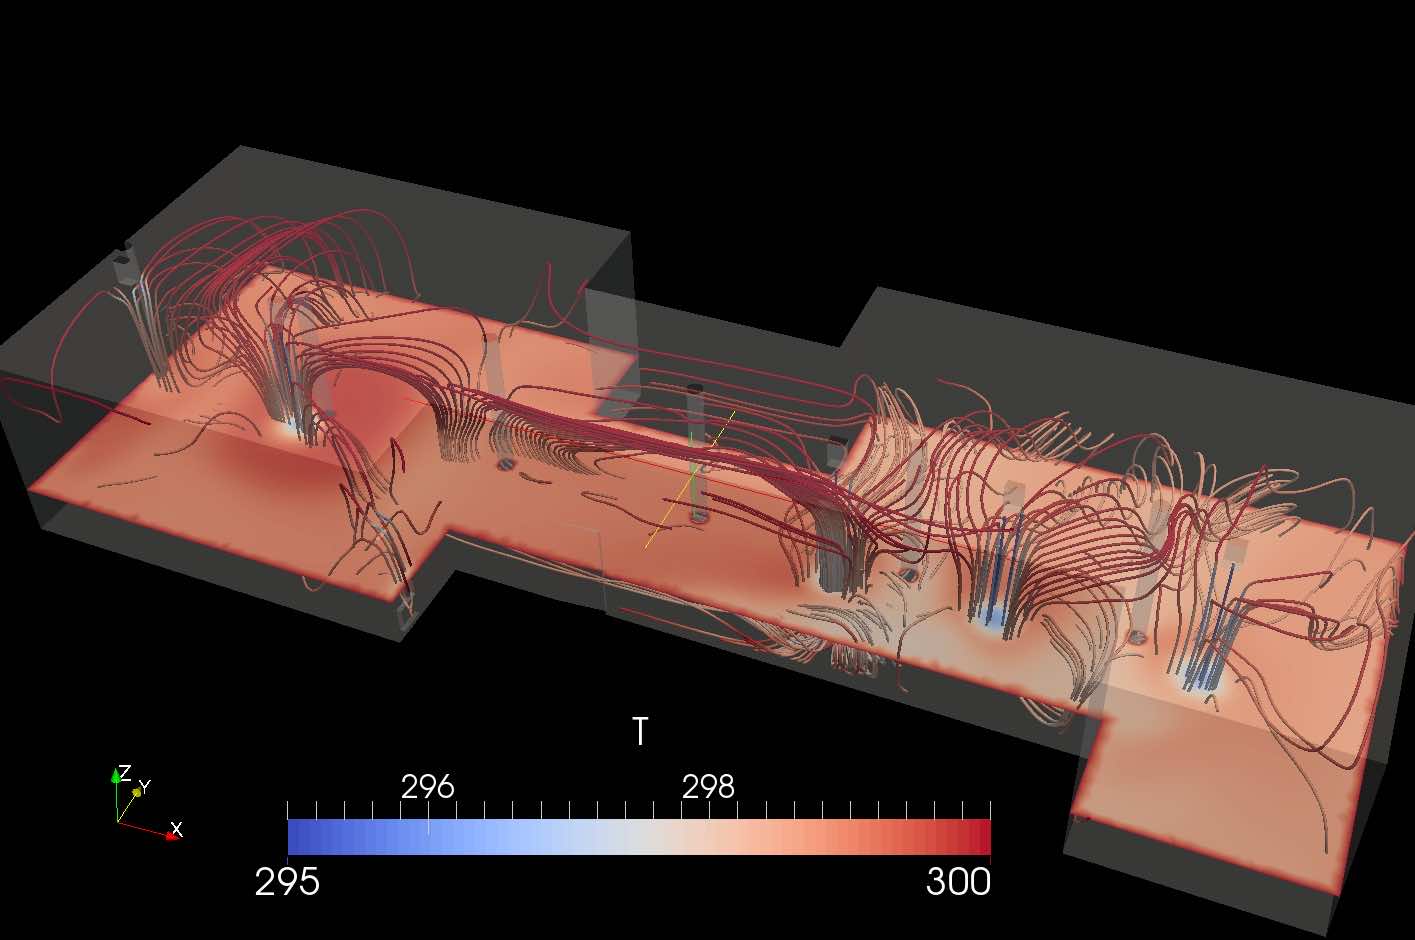
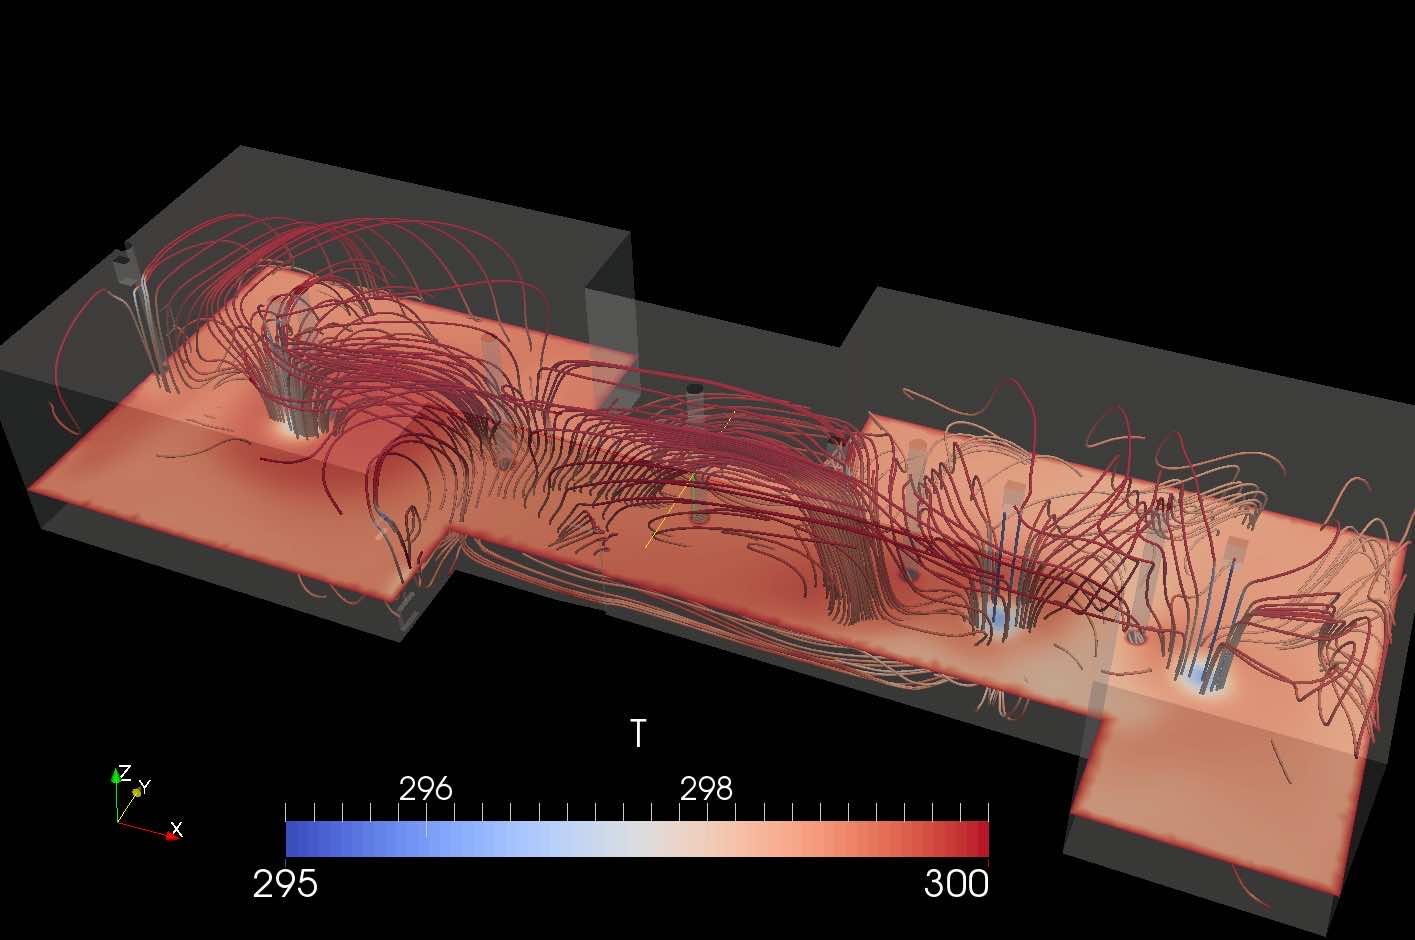
Case 1 is the coldest of all the cases we could expect and serves a reference point to compare all other results. Cases 4 and 5 are polarizations of hot and cold ends where one side turns on the air conditioning while the other side turns it off–leading to situations we wish to avoid. The cases where we see a better temperature distribution are Case 2 and Case 3.
Whether a solution will be implemented is yet to be determined–potential additional work could include an optimizer wrapping the CFD analysis. But this was a first step towards ending the fight over the thermostat.