Economics Dashboard
Overview
The Economics Dashboard gives customers a birdseye view of their monthly compute and software spending across projects and teams helping you prioritize projects and reallocate resources. It is supported at both Organization and WorkspaceWorkspaces allow rescale customers to create dedicated teams... More levels.
Widgets on the Economics Dashboard
Charges Widget
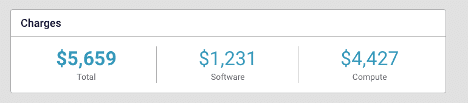
Charges widget displays the monthly total charges, software charges, and compute charges (hardware) for the workspace or organization in the selected month.
Budget Widget
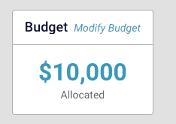
Budget widget displays the total available budget across all monthly recurring project budgets for the workspace in the selected month. Note that this is only shown at the workspace level.
Projects Widget
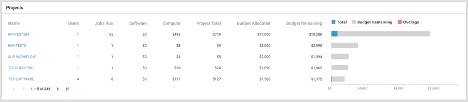
The Projects widget is composed of 2 parts
- Projects Table on the left
- It lists all the projects with recurring budgets in the given workspace or organization, along with the
- Users – Number of users in the project
- Job Runs – Number of jobs run in the project in the selected month
- Software – Software charges for the project in the selected month
- Compute – Compute charges for the project in the selected month
- Project Total – Total charges for the project in the selected month
- Budget Allocated – Amount of budget allocated for the project
- Budget Remaining – Amount of budget remaining for the project in the selected month
- It lists all the projects with recurring budgets in the given workspace or organization, along with the
- Projects Chart on the right
- It displays a Pareto chart with the following information
- Total – Total charges generated under the project in the selected month are shown in blue color
- Budget Remaining – Remaining budget for the project is shown in gray.
- Overage – Charges that exceed the budget amount are shown in red.
- On hovering over each bar, the tooltip shows the amount.
- It displays a Pareto chart with the following information
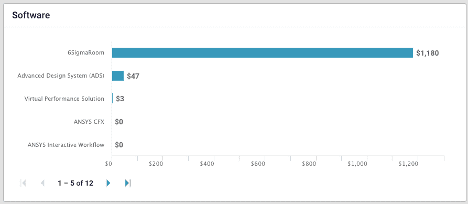
Software Widget
Software Widget displays the software charges for the workspace or organization in the selected month. Each software is shown as an individual bar. This information is the same as the Utilization Dashboard.
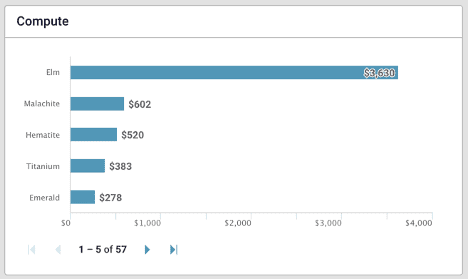
Compute Widget
Compute Widget displays the compute charges for the workspace or organization in the selected month. Each corean individual processing unit within a multicore processor o... More type is shown as a separate bar. This information is the same as the Utilization Dashboard.