ANSYS Fluent FAQs
This tutorial shows you how to insert a check-fluent or exit-fluent file in the job directory of your running clusterA computing cluster consists of a set of loosely or tightly ... More in order to stop the iteration and write case/data files.
You will need first set up your SSH to perform this task. If you have not already done so, please follow the guide here. Click on the Servera server is a computer program that provides services to oth... More IP address on the SSH panel on the Status page to launch your SSH session, and follow the instructions below.
check-fluent file
A check-fluent file triggers Fluent to write and save case and data files at the end of the current iteration. The simulationSimulation is experimentation, testing scenarios, and making... More will then continue to solve.
To insert a check-fluent file, enter the following commands in your SSH session (2 lines). cd /tmp touch check-fluent
For instanceAn Amazon Virtual Machine More, if the journal file is setup to run for 500 iterations and a check-fluent file is inserted during the 28th iteration, then a case and data file will be created with the iteration step appended to the file name. The simulation will continue and complete the 500 iterations. The following files will be available in the Results page of the job.
tjunction_plot0028.cas.gztjunction-plot0028.dat.gztjunction_plot0500.cas.gztjunction-plot0500.dat.gz
exit-fluent file
An exit-fluent file, triggers Fluent to write and save case and data files at the end of the current iteration. The simulation will then terminate and exit Fluent.
To insert an exit-fluent file, enter the following commands in your SSH session (2 lines). cd /tmp touch exit-fluent
For instance, if the journal file is setup to run for 500 iterations and an exit-fluent file is inserted during the 28th iteration, then a case and data file will be created with the iteration step appended to the file name. The simulation will not continue. The following files will be available in the Results page of the job.
tjunction_plot0028.cas.gztjunction-plot0028.dat.gz
This tutorial shows you how to generate a residual plot during an ANSYS Fluent batch job. We will show two ways how you can accomplish this:
1. Setting it up on the Fluent GUI
You can use this method when you are setting up a job on a Rescale Desktop or your own local workstationA workstation is a powerful computer system designed for pro... More.
- Open the relevant modelA numerical, symbolic, or logical representation of a system... More in Fluent
- Go to the
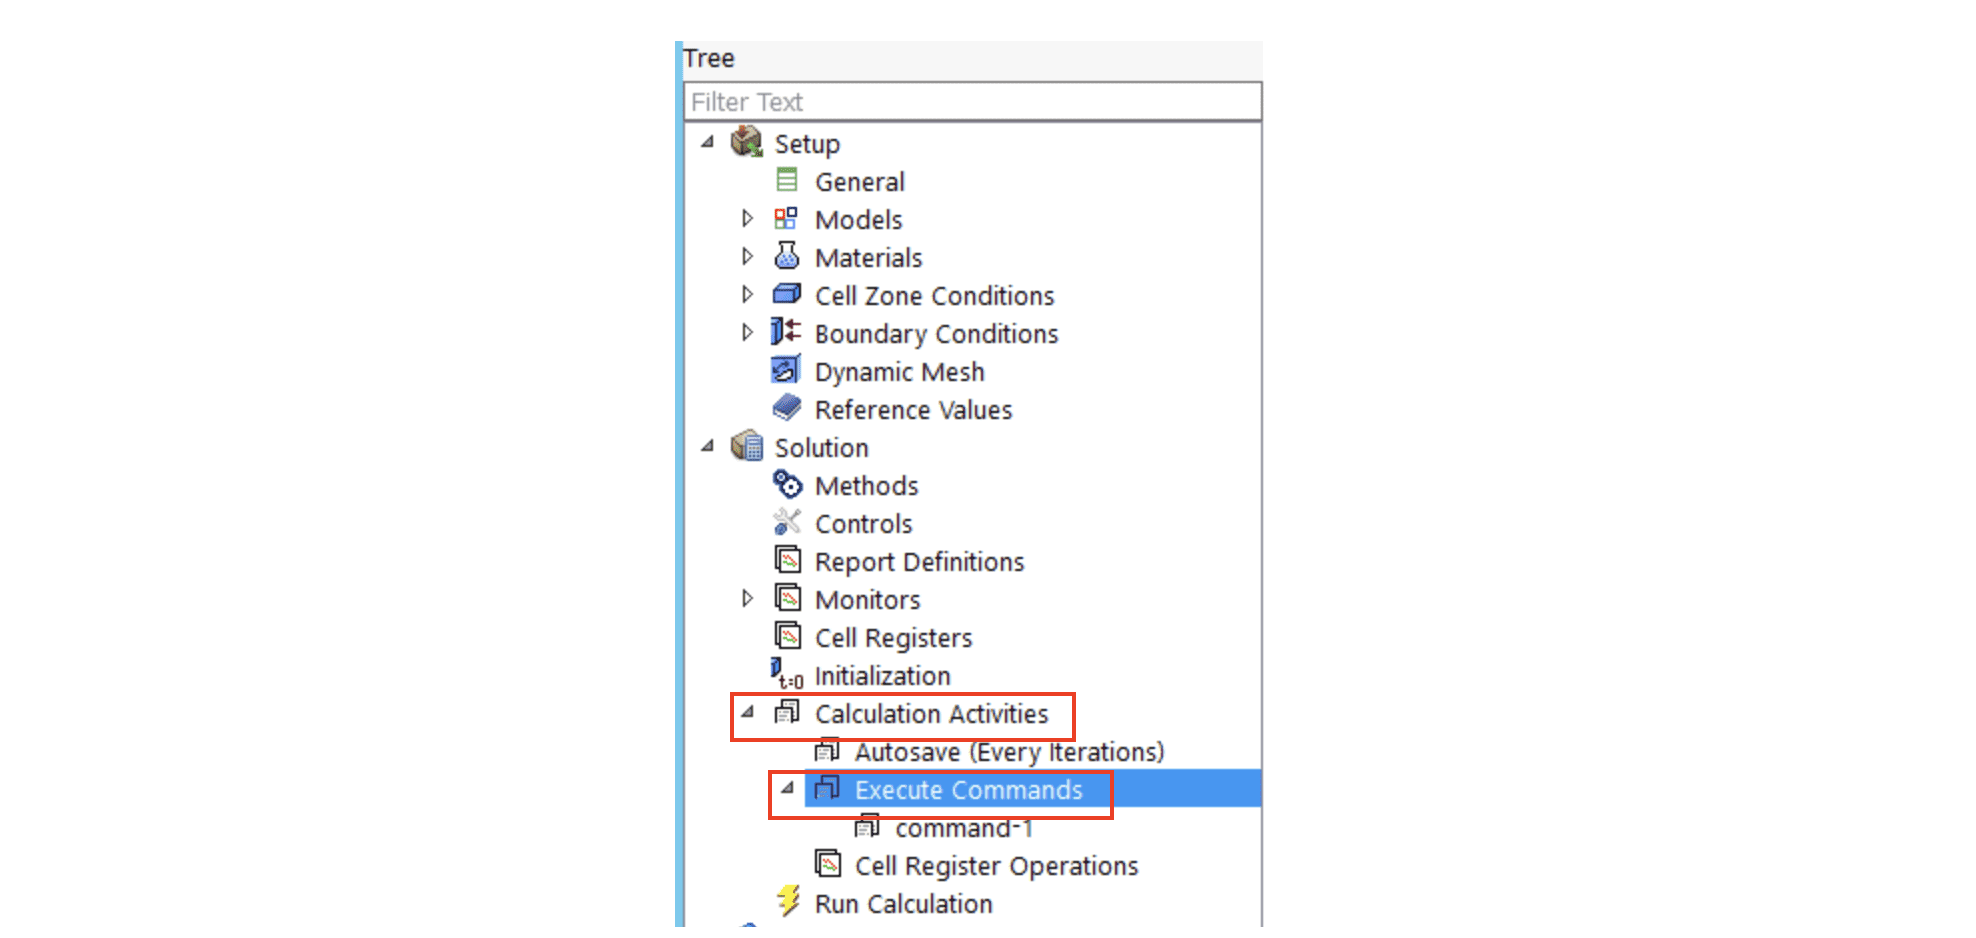
Solutionsub-tree on the main menu. Click onCalculation Activitiesand then onExecute Commandsin the setup tree. This will open a dialog box toDefine Commands
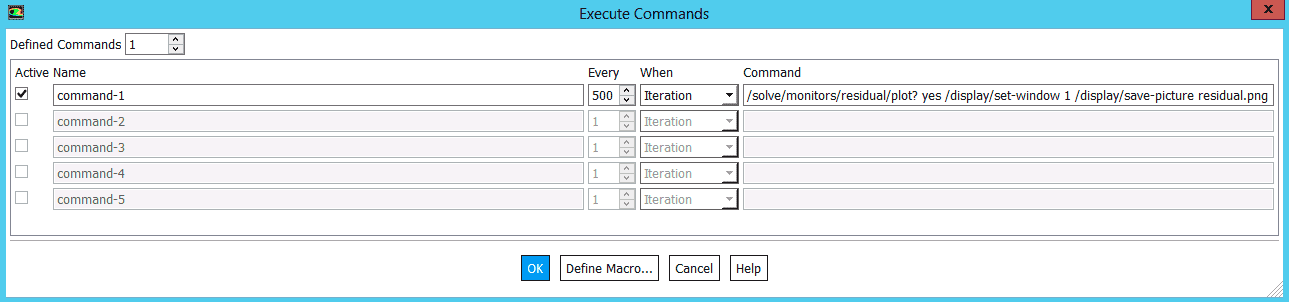
- Enable the
Activecheck button next to the command - Enter a name for the command under
Name - Indicate how often you want the residuals plotted by setting the interval under
Everyand selectingIterationorTime Stepin the drop-down list underWhen. Time step is a valid option for unsteady flow - Under
Commandtype:
/solve/monitors/residual/plot? yes /display/set-window 1 /display/save-picture residual.png
- Click on
OKto save the changes
2. Setting it at the journal file
You can use this method when you are setting up a batch job on the Rescale platform.
- Enter the following into the journal file after initialization and before solving
/solve/execute-commands/add-edit command-1 500 "iteration" "/solve/monitors/residual/plot? yes /display/set-window 1 /display/save-picture residual.png"
Note:
In the command line above, command-1 500 "iteration" allows to print residuals every 500 iterations. 500 iterations is used here just as an example and may not be suitable for all jobs. Determine the frequency appropriate for the length of your job and modify command-1 500 "iteration" as needed. Rewriting the residuals too often may cause the job to slow down.
A sample journal file with residual plot setup is shown below. Here, the run time is 7500 iterations and residuals are plotted every 500 iterations.
/file/set-batch-options no yes yes no/file/rc tjunction_plot.cas/solve/init/init//solve/execute-commands/add-edit command-1 500 "iteration" "/solve/monitors/residual/plot? yes /display/set-window 1 /display/save-picture residual.png" /solve/iterate 7500/file/wcd tjunction_plot%i.cas.gz/exit yes
Live Tailing and Results
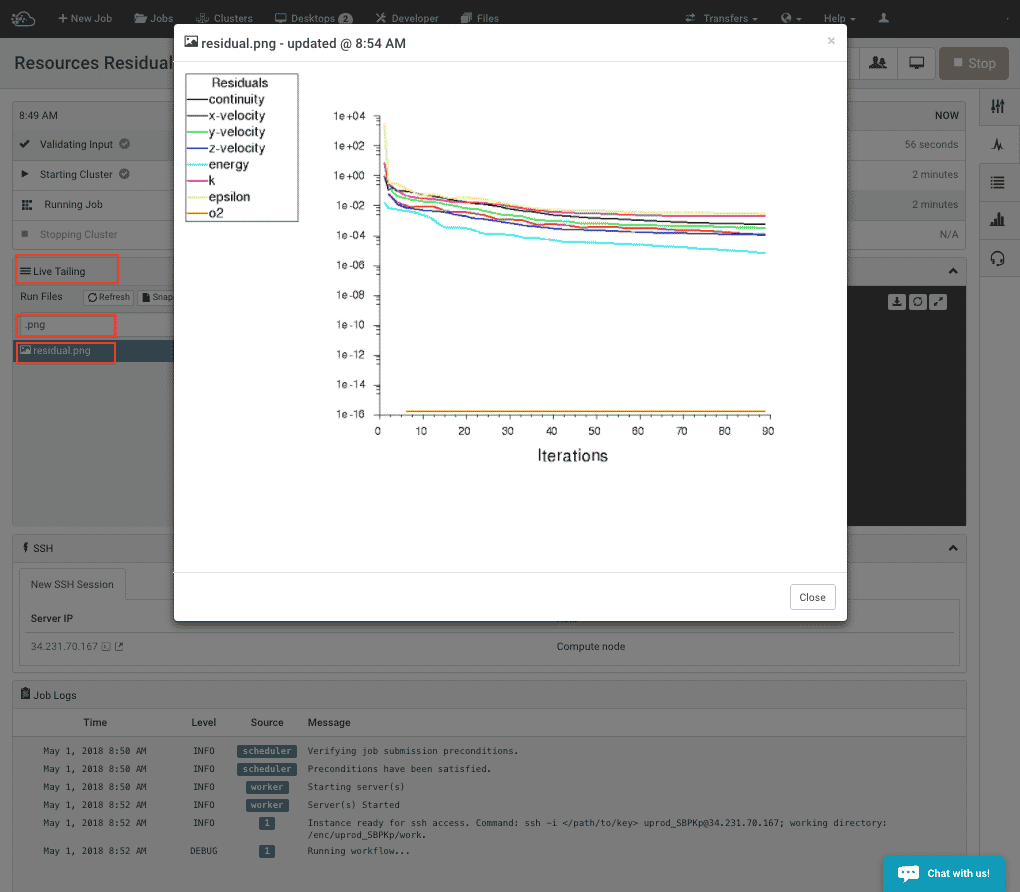
You can view the residuals plot during the batch run using the live tailingalso referred to as real-time log monitoring or live log str... More feature. Once the job has started running, the Live Tailing panel is displayed. The residuals.png file should be created after the first few iterations. Search for `.png’ file. Click on the file to display the plot.
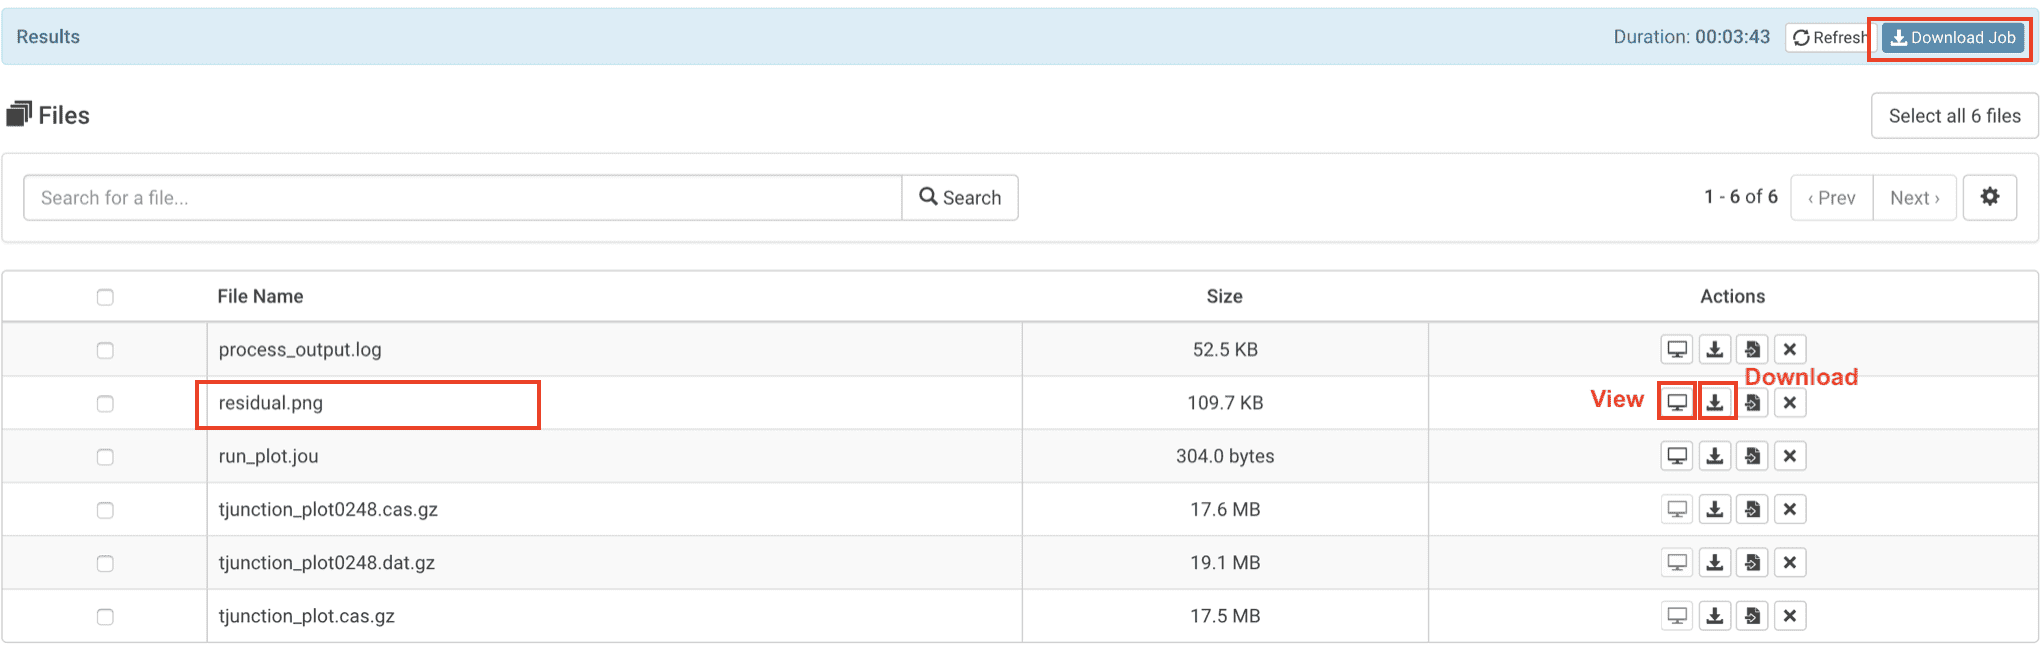
Once the job is completed, the residuals plot file is populated on the Results page along with the other job files. Click on View icon to view the file. You can also download the residuals plot file by clicking on Download icon or download all job files by clicking on the Download Job icon.