
Post-Processing Job Results
Last updated: June 1, 2022
Overview
The Rescale platform’s post-processing functionality allows you to extract, process, and display selected data from output files directly on the Rescale platform and without the need to transfer data to your local machine.
The post-processing capability allows you to fully take advantage of the powerful hardware provided by Rescale, as well as reduce the time to viewing results by reducing data transfer. Jobs with multiple runs also give you the additional ability to view charts based on your defined input parameters, along with any output parameters extracted from your simulationSimulation is experimentation, testing scenarios, and making... More output files.
To fully take advantage of the charting capability, you must write a post-processing script to parse your data files (e.g. a Python or a Shell script). The extracted parameters must be output in a tab-separated format, described below, to be used in the charting functionality.In this tutorial, we will expand the 2D airfoil Design of Experiments (DOE)DOE stands for "Design of Experiments." It is a statistical ... More example described in the DOE tutorial to examine the airfoil performance directly on the Rescale platform. The input files, parallel settings, template file, software settings, and hardware settings for this tutorial are identical to those in the DOE tutorial.
Output Format for Post-processing
Each variable that you want to extract, and its value, should be written on a separate line to stdout. The line should be in tab-separated format, i.e. the variable name, followed by a “tab”, followed by the variable value.
In a Bash script this might look like:
printf "%s\t%s\n" "variable" "$stringValue"
Or in Python:
`print(f"variableName\t{value})`
Uploading a post-processing script
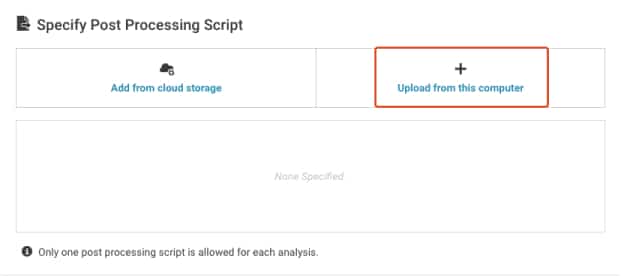
The post-processing step of the setup process is the same whether you are running a basic job with a single run, or one with multiple runs, such as a DOE. Post-processing is typically set up after defining the hardware settings for the job. The setup page is seen in the image below. Upload a post-processing script by clicking Upload from this computer.
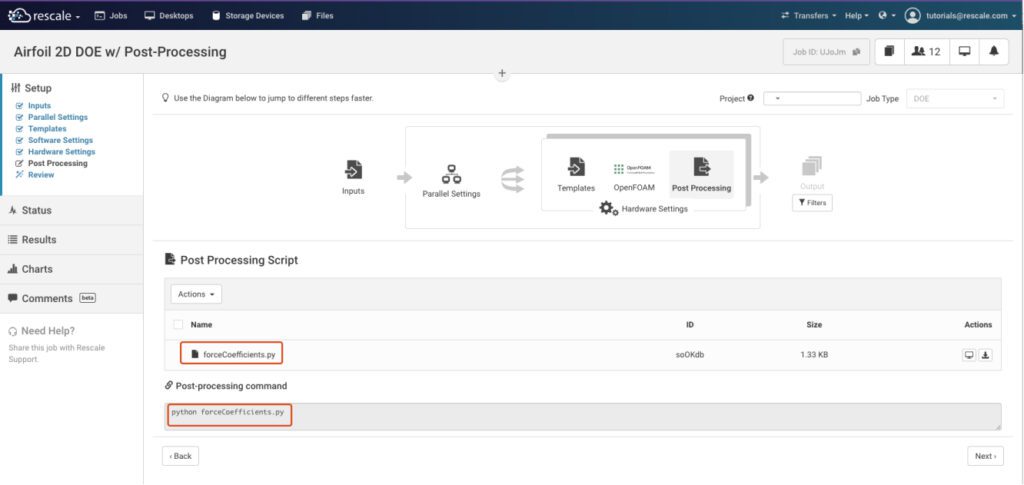
After uploading the script, you must specify a command to execute it. The image below shows how an uploaded Python script, forceCoefficients.py (which extracts the lift and drag coefficients), is called to process the results. The post-processing command is highlighted in red.
Note: The post-processing script is executed from the working directory of the individual run. Therefore, the relative path to output files is the same for all runs.
The same process is also applicable for a shell script. Regardless of the script type, the variables must be output from the script in the tab-separated format described in the previous section.
Once the post-processing setup has been completed, the job can be submitted and will run normally. The post-processing script will be executed at the end of each individual run to process the output files produced during that run.
Post-processing script output
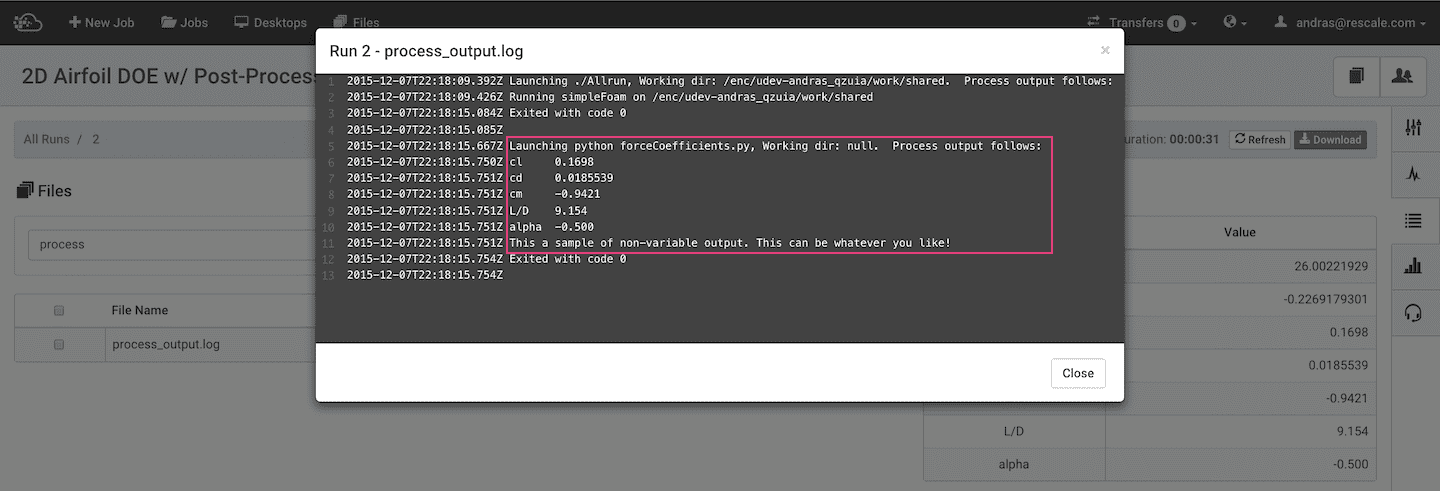
Post-processing scripts must output data in the tab-separated format to be registered as “variables” by the Rescale platform for display and charting. Scripts, however, can also output additional information for your use. The entire output of the post-processing script can be found in the process_output.log of the individual run, as shown below.
In this way, you can output other useful information as desired in your post-processing scripts. In the image below, the variable output can be seen in the process_output.log.
Results
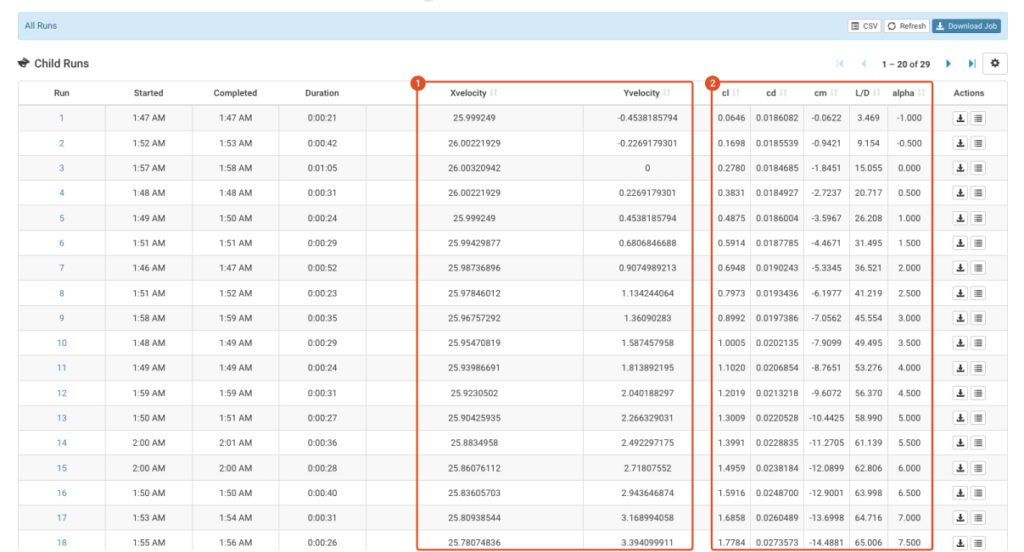
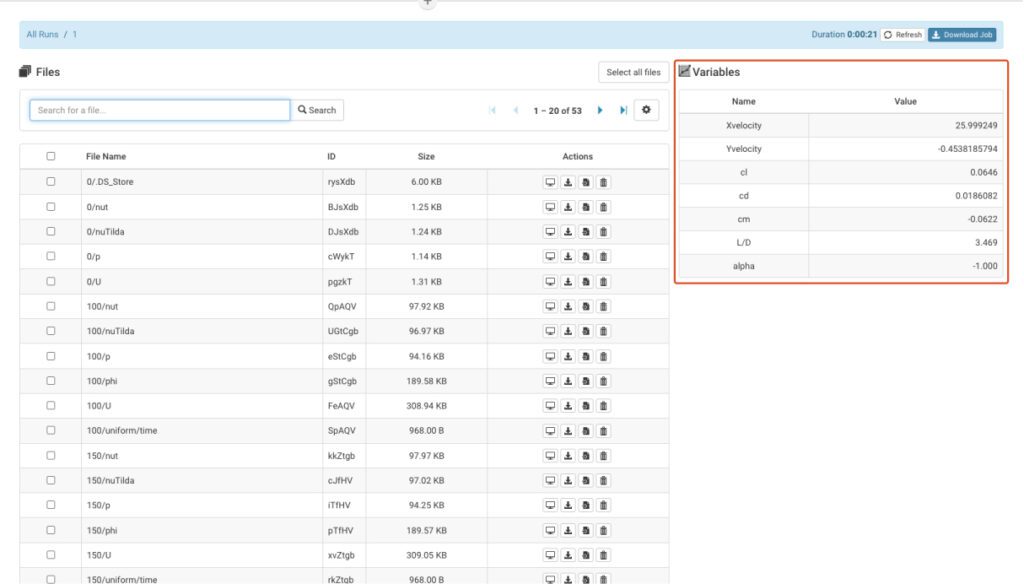
The image below shows the Results tab for a completed DOE job with post-processing. The variables that were defined in Parallel Settings, i.e. the input conditions, for this DOE job are highlighted in Box 1. The variables extracted and output by the post-processing script also appear in the Results tab and are highlighted in Box 2. This tabular view allows you to quickly examine the data for all the runs.
Clicking the Run number in the left-most column opens the page for the individual run. In this page, the output files from the selected run can be viewed, downloaded, or made available for use in future jobs. The input and output variables are shown in the Variables table, as highlighted below.
Next steps
By extracting output variables using a post-processing script, you can then take advantage of the Rescale charting capability and generate charts directly on the Rescale platform. There are three different types of charts available:
- Scatter
- Area
- Surface
You can select the combination(s) of input and output parameters to be plotted using the table on the right hand side. Below is a sample scatter chart from the 2D Airfoil DOE. In this case, the chart is plotting the lift coefficient versus the drag coefficient.
Note that multiple data series can be plotted on a Scatter plot, although only one data series is shown below.
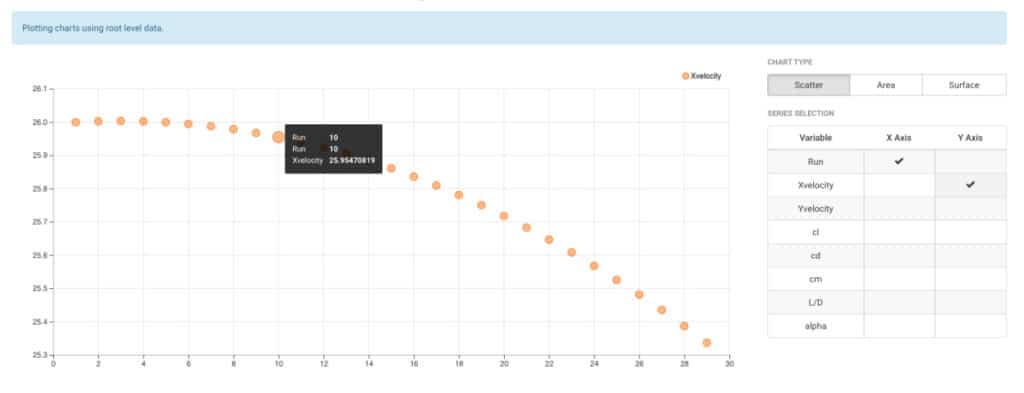
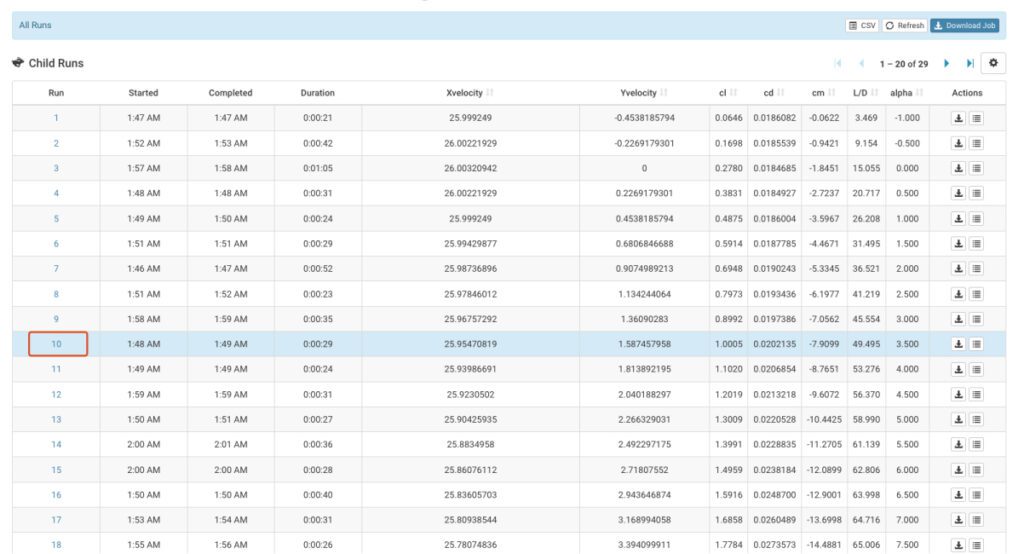
Hovering your cursor over a single data point in a Scatter plot, a data box appears showing the X/Y values for that point, as well as the number of the run that produced the data (as shown above). Clicking the point highlights the run in the results page as below.
Note: Surface charts are created using a grid based on your input data, along with a weighted average interpolator. As a result, surface values of your chosen “Z” variable may differ significantly from the values of nearby points.