
Performance Profiles
Performance Profile is entitled to customers as part of the Rescale Enterprise Edition.
Overview
This page is dedicated to instructing you on how to use Performance Profiles. In order to access the Performance Profiles feature, you must explicitly have access from your Organization Administrator.
Performance Profiles enable you to run multiple jobs (with different hardware) using a singular workloadWorkload refers to the amount and type of computing tasks or... More to benchmarkA standard or point of reference against which things may be... More which architecture provides the best workload-specific price versus performance.
Without Performance Profiles, you must blindly follow your gut instinct on hardware choice or run ad-hoc benchmarks using spreadsheets. With Performance Profiles, engineering leaders can run benchmarks in a self-service manner, which will be plotted on a graph of cost vs. time.
Benefits of Using Performance Profiles
With Performance Profiles, you will have the ability to seamlessly run benchmarks, which will afford you the following benefits:
| Use Case | With Performance Profiles | Benefit |
| Optimized Templates | Simply set your Profile Configuration as an existing template and run a variety of CoreTypes and at various numbers of cores | Speed up or reduce cost by applying new templates to your entire organization |
| Determining what CoretypePre-configured and optimized architectures for different HPC... More is the best go-to choice for general workloads | Run multiple Profiles against the same CoreTypes and compare which CoreType comes out ahead; look for infrastructure on the Pareto front whether you’re optimizing for cost or time | Simplify your stack and choose the best CoreType for your specific workloads whether it be for optimizing for time or reducing cost |
| Finding the cheapest Coretype for a specific workload | Load up a Profile Configuration as a previous or future job and run a variety of CoreTypes and at various numbers of cores; look for infrastructure that leans toward the bottom left | Know which infrastructure will result in the cheapest cost, which will end up saving on your compute bills |
How to Use Performance Profiles
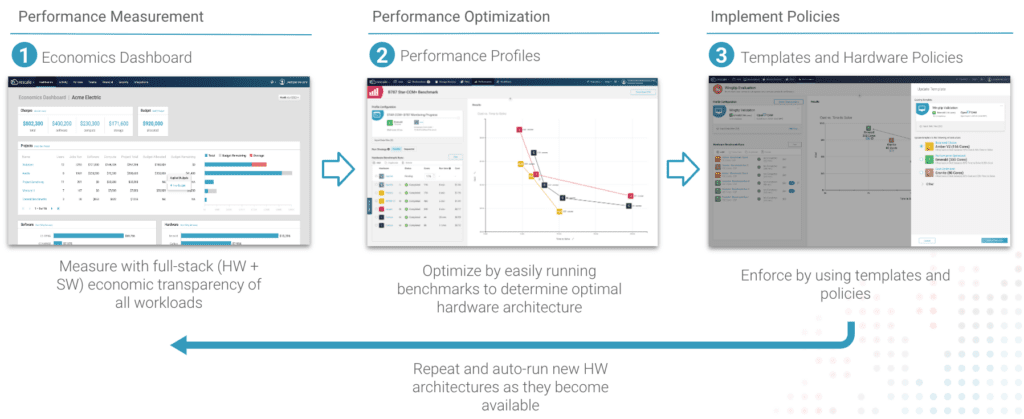
We recommend using Performance Profiles by following three (3) easy steps:
- Performance Measurement: Identify areas of opportunity for optimizationOptimization is a systematic method to determine the values ... More using the Economics Dashboard
- Performance Optimization: Run hardware benchmarks on Performance Profiles to identify the best hardware infrastructure for your workload
- Implement Policies: use templates in order to enforce hardware infrastructure configurations
Performance Home
From the Performance Home page, you can view, manage, and configure new and existing Profiles.
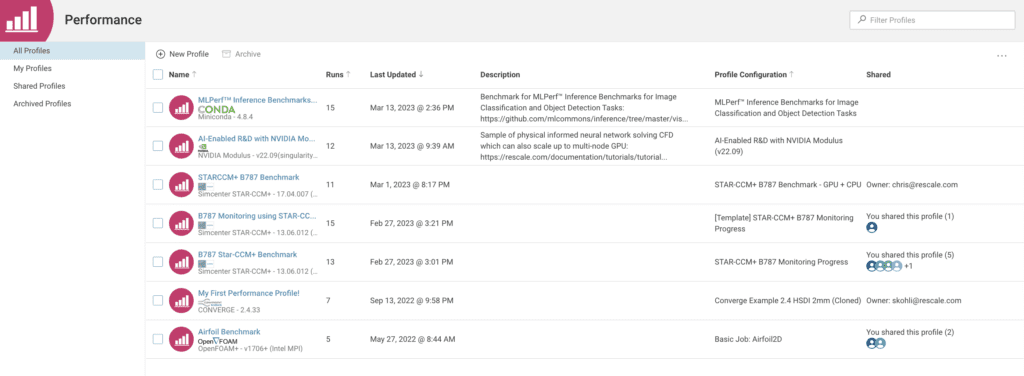
A Profile represents a specific workload that you are using to benchmark against multiple architectures, thus reducing the number of variables that you are measuring, giving an accurate representation of how a certain architecture performs for your given workload.
Available Performance filters include:
- All Profiles
- My Profiles & Shared Profiles
- My Profiles
- Profiles you’ve created
- Shared Profiles
- Profiles that have been shared with you
- Archived Profiles
- Profiles that you’ve archived
There are six columns available for profiles:
- Name
- Given profile name
- Runs
- Number of infrastructure benchmarks run against this profile
- Last Updated
- Last time a benchmark was run in the profile
- Description
- The given description of a Profile
- Profile Configuration
- The name of the template or job that was used to create the Profile
- Shared
- Who you’ve shared the profile with or the person who shared the profile with you
Managing Columns and Filters
On the Performance Home page, select the (…) icon to customize your filters and filter column headers.

Setting up a Performance Profile
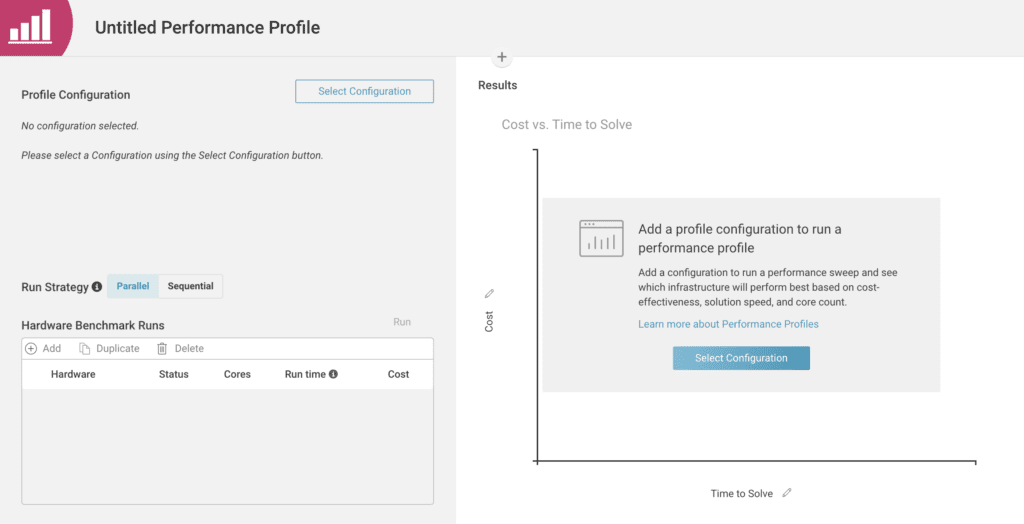
To create a new Profile, select New Profile from the top left of the Performance Home page. Upon selecting New Profile, you will be given a blank Performance Profile.
Naming your Performance Profile
First, you’ll want to give this Performance Profile a descriptive name so that you can understand what this Profile is about. In order to change the Name, click Untitled Performance Profile to give it a unique name, and then confirm your selection by pressing the green checkmark.

Selecting your Profile Configuration
Next, you’ll want to select your Profile Configuration which can be done by clicking Select Configuration. This will open a drawer that gives you the ability to select your configuration from
- Templates
- Jobs (Completed Jobs)
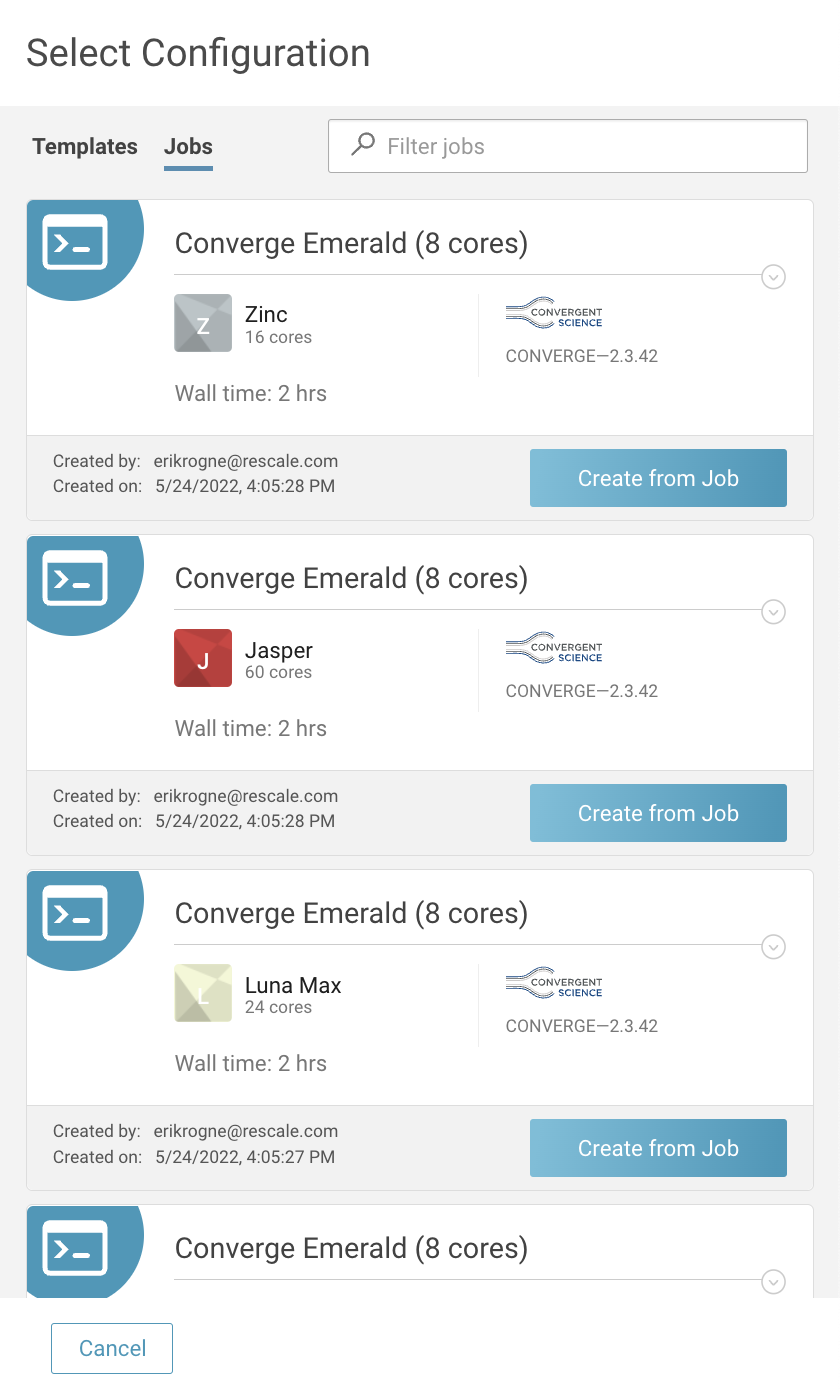
Please note that you will not be able to change the Profile Configuration once you have run your first benchmark.
Adding your Infrastructure
After selecting your Profile Configuration, you’ll need to add your infrastructure. To do so, click Add Infrastructure or the Add button from the table, which will open a drawer with a hardware selection.
Select the hardware you want by selecting the checkbox for each item and selecting the number of cores. If you’re not sure what to select, you can compare CoreTypes using the CoreType Explorer that is linked in this drawer.
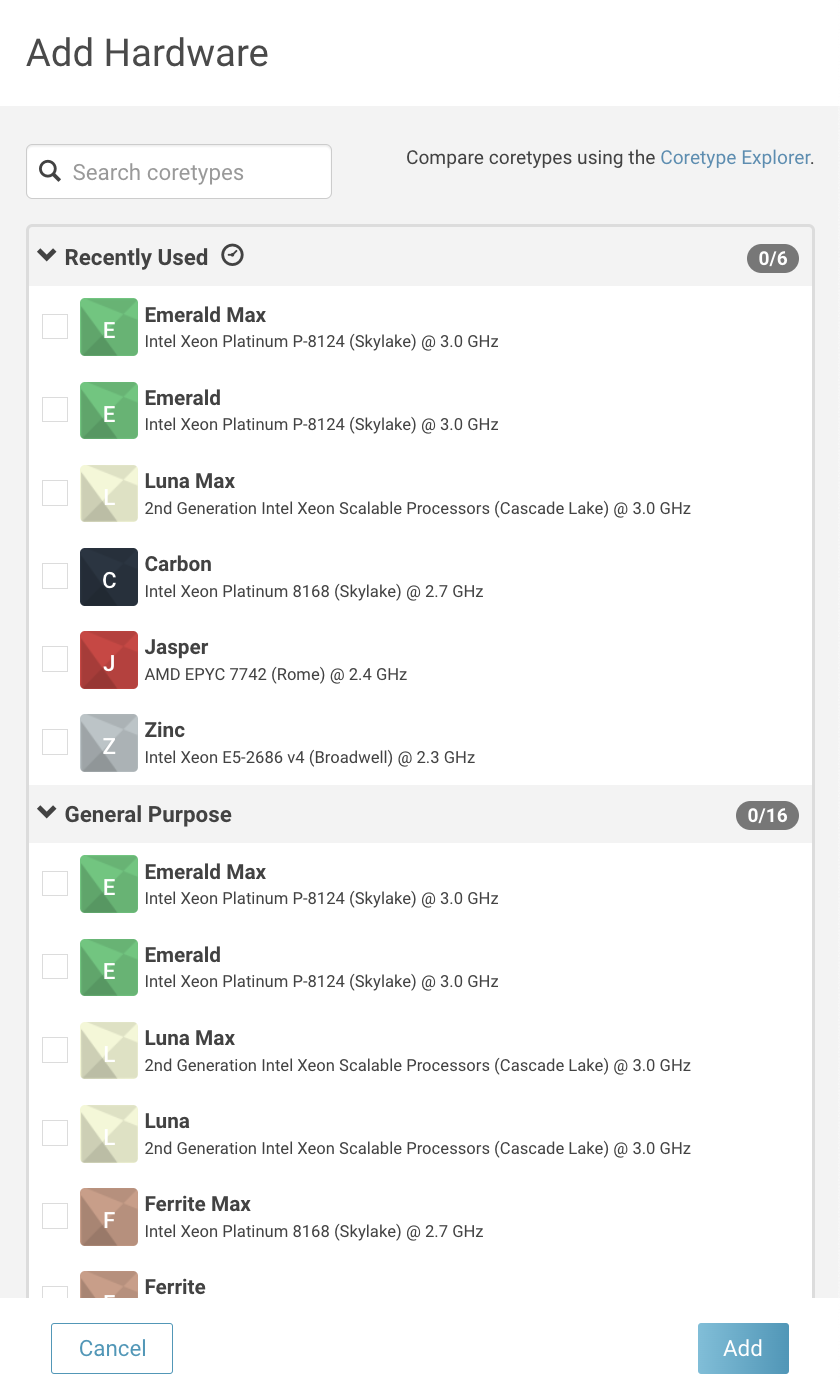
Once you’ve selected your hardware, click Add.
If you forgot to add hardware or would like to run the same hardware using different numbers of cores, you can click Add to select additional hardware.

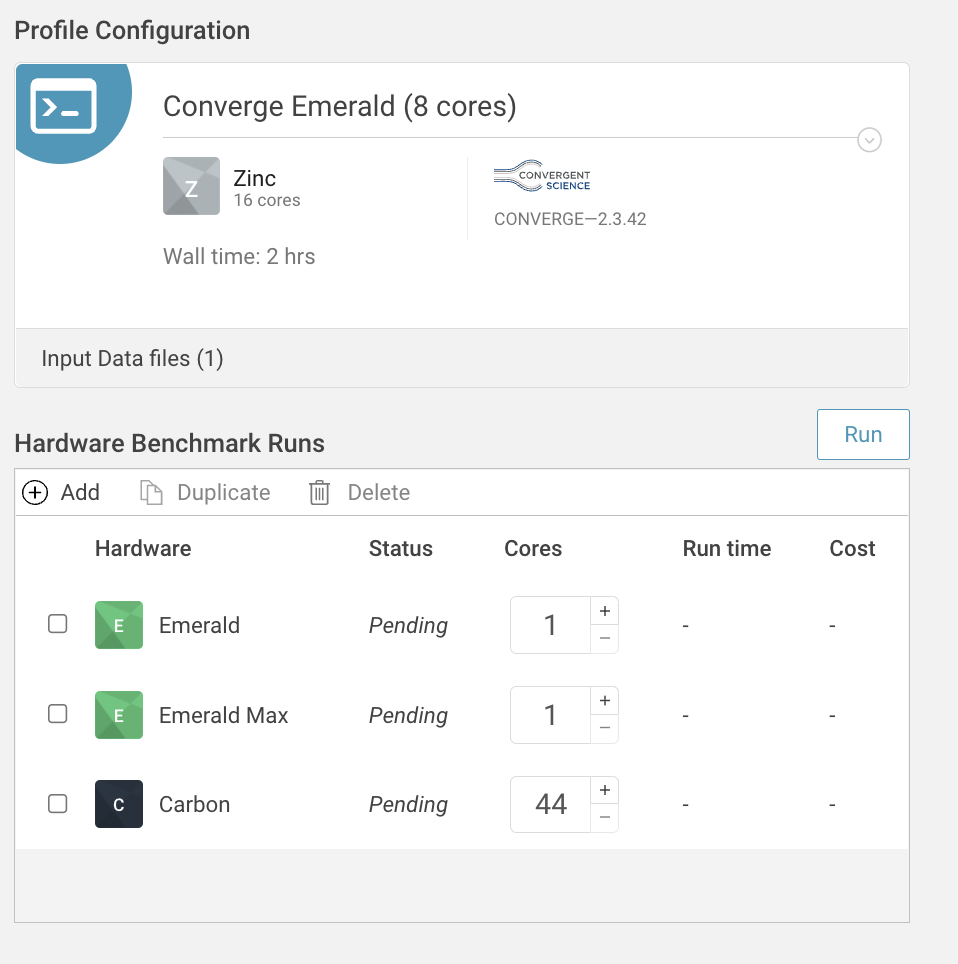
Reviewing Selections
You’re almost ready to kick off your Profile! Review your hardware selections, ensuring the correct hardware and number of cores. Once you’re ready, click the Run button to kick off all Pending Hardware Benchmark Runs.
Now, kick back and wait for your benchmarks to finish. When you come back, you’ll be able to view them on the graph.
Reviewing your Performance Profile
Get hands-on, by viewing our Star-CCM+ CFD benchmark.
After your benchmark runs have been finalized, you can view the results on the graph and the table.
Performance Profile Table
The table will show you a list of all of your hardware benchmark runs, the current status, run time, and cost. This table will give you a detailed view of your runs that have been completed.
Note that the run time defaults to execution time only, which means Rescale excludes time spent in preconditions, starting, stopping, etc. The cost reflects both the total hardware and software cost.
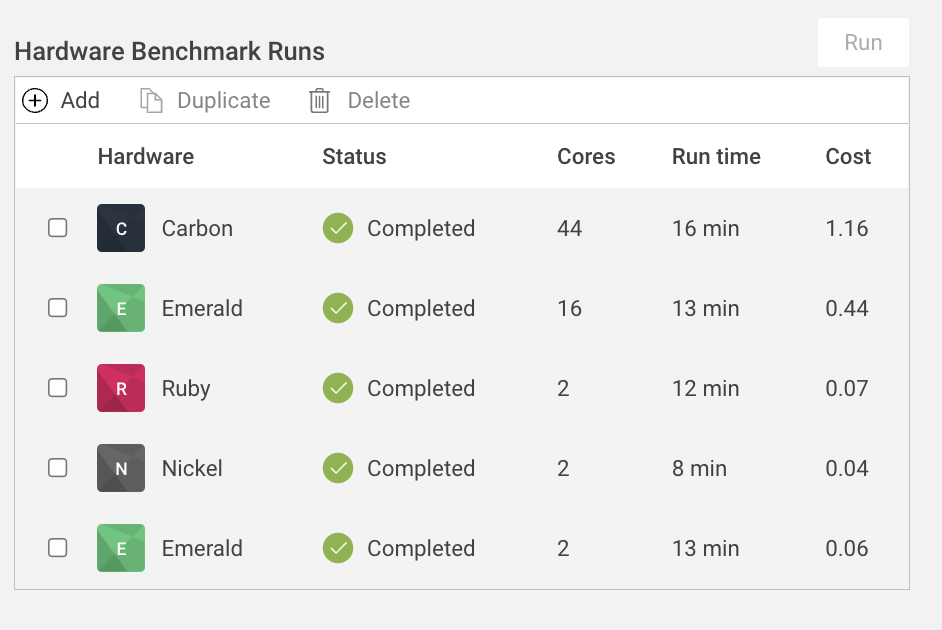
If you have any outliers that you’d like to remove from both the graph and the table, click the checkbox next to that hardware benchmark and click Delete.
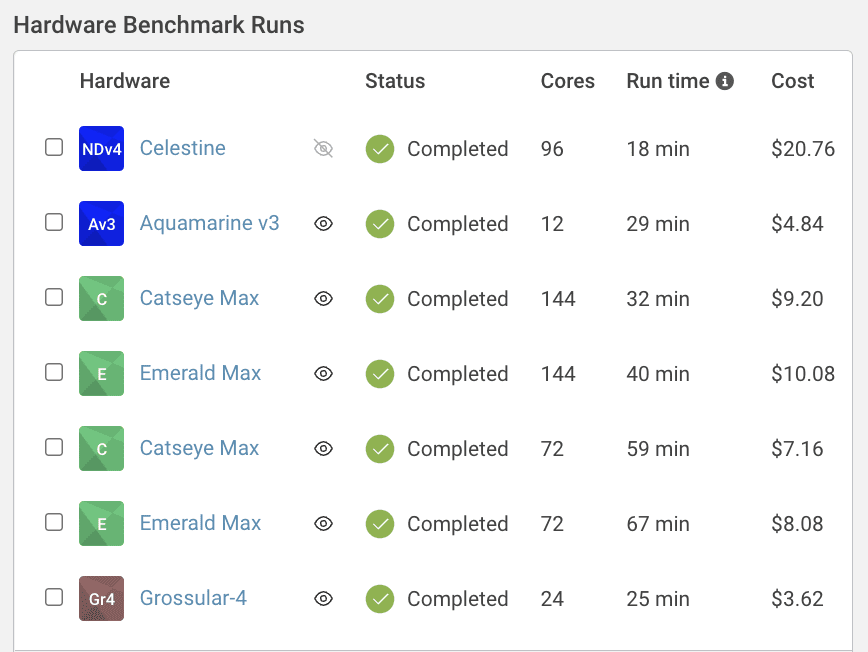
You can always add additional infrastructure to the Profile by clicking Add and you will be given the chance to run this new benchmark. When you click Run, only the newly added benchmark will run, and not the previous benchmarks.
Additionally, you have the option to hide benchmarks on the graph by clicking the “eye” icon. See Celestine hidden below.
Performance Profile Graph
The graph will show your plotted benchmarks of Cost vs. Time to Solve as a default, with the option to toggle the column axis.
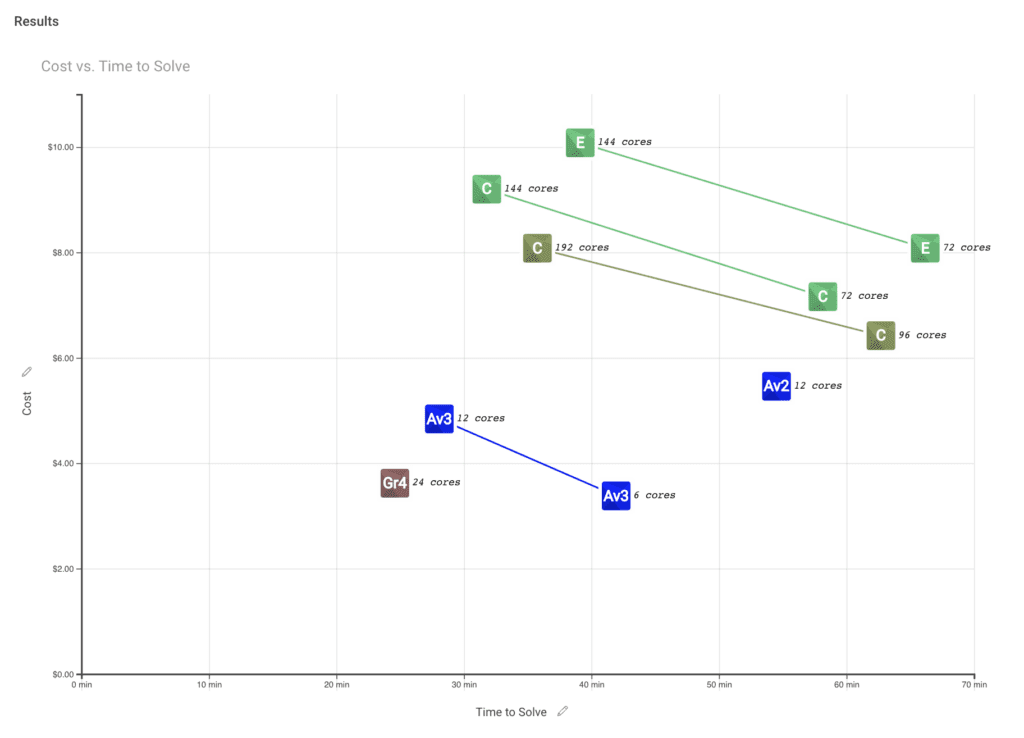
If you highlight a benchmark, you will be given a view of the time and cost of the benchmark.
When evaluating the benchmarks, we recommend finding balanced hardware which can be found in the bottom left corner of the graph. With more complicated benchmarks and requirements, we recommend always looking at the benchmarks on the Pareto Front to select the most efficient hardware.
X- and Y-Axis Options
| Axis Data | Definition |
| Cost | The cost to run the job (USD default). |
| Time to Solve | Time to run the job (in minutes). Defaults to execution time only, which excludes time spent in preconditions, starting, and stopping. |
| Number of Cores | The number of cores used for a specific set of hardware. |
| Carbon Emissions (coming soon) | The number of CO2 emissions emitted by running the hardware, which is the amount of power (kW) it takes to run a job converted in CO2 emissions. |
Downloading Your Performance Profile CSV
If you prefer to do your own analysis and plotting in a tool like Excel or Google Sheets, you can click Download CSV in the top right corner. This will immediately download a CSV.

| column | definition | example |
| benchmark_name | name of the profiled job | [Performance Profiles] Wingtip Evaluation – Emerald 100 |
| template_name | name of the profile configuration used | Wingtip ValidationValidation is the act of ensuring that a product, system, or... More |
| software_name | software and version, comma-separated | OpenFoam v1, Notepad++ v3.0 |
| run_number | benchmark run number | 4 |
| coretype_name | name of the hardware | Emerald Max |
| unit_price | The price per corean individual processing unit within a multicore processor o... More for the given coretype | $0.0209 |
| core_count | number of cores for the benchmark | 144 |
| processor | processor name | Intel Xeon Platinum P-8124 (Skylake) |
| start_timestamp | timestamp when the benchmark started | 2022/10/26 23:30:30 |
| end_timestamp | timestamp when the benchmark ended | 2022/10/27 0:09:38 |
| unit_hours | (run_time_minutes / 60) * core_count | 62.7244 |
| run_time_minutes | time to run the benchmark | 39 |
| cost | cost of the benchmark | $10.08 |
| performance_score | min-max normalization; a higher score is better (0 is lowest, 10 is highest) | 10 |
Adding a Description
We recommend adding a description so that you can track which hardware performed the best and what the purpose of this Profile is. To do so, click the (+) to show the description.

Modifying the Run Strategy
Run the benchmarks either in parallel or serial by selecting the run strategy. Consider using this if you don’t want to utilize all available software licenses if that is a constraint.

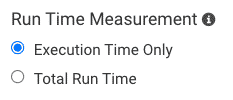
Modifying Run Time Metric Definition
By default, Run Time is defined as execution time only, which means Rescale excludes time spent in preconditions, starting, stopping, etc.
You have the option to switch the Run Time to be total run time, which is defined as the total time it takes to run a job (including starting, stopping, etc).
If you could like to modify the Run Time Measurement, go to Policies > Platform Settings > Performance >Run Time Measurement.
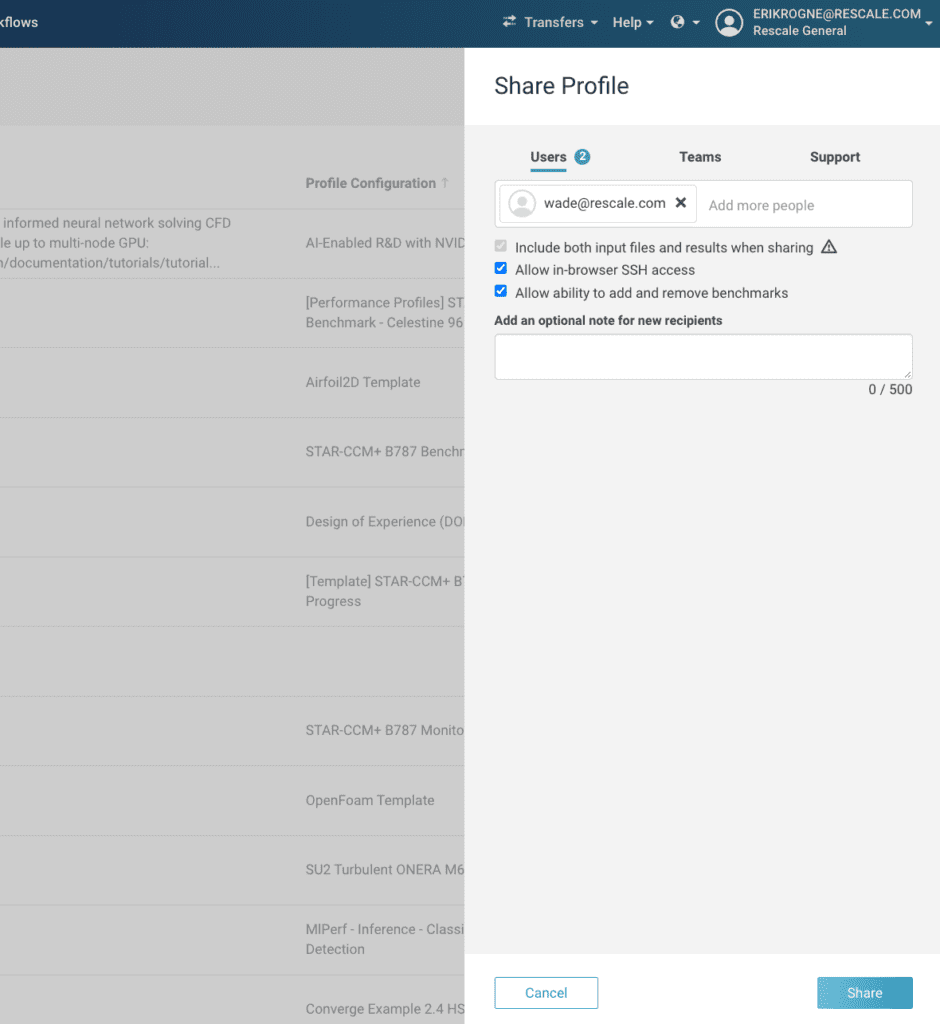
Sharing Performance Profiles
Performance Profiles can be shared with other users in order to view the benchmarks.
| Sharing Functionality | Required/Optional | Description |
| Include both input files and results when sharing | Required | Gives full access to all benchmarks and graphs in Performance Profiles |
| Allow in-browser SSH access | Optional | Allows users to SSH into a running job |
| Allow the ability to add and remove benchmarks | Optional | Allow shared users to add and remove benchmarks from a Performance Profile |

Performance Profiles Intelligence Features (Coming Soon)
Performance Profiles is an innovative tool that helps you optimize your hardware infrastructure for your workloads. With its powerful features, you can easily recommend hardware infrastructure benchmarks and determine the best-performing hardware infrastructure.
Recommend Hardware Infrastructure to Benchmark
With Performance Profiles, you can quickly and easily recommend hardware infrastructure to benchmark that is best suited for your workload. To get started, simply click on the Make Recommendations button, and Performance Profiles will automatically select the top 5 recommended hardware across 3 core counts to create 15 benchmarks for you to review.
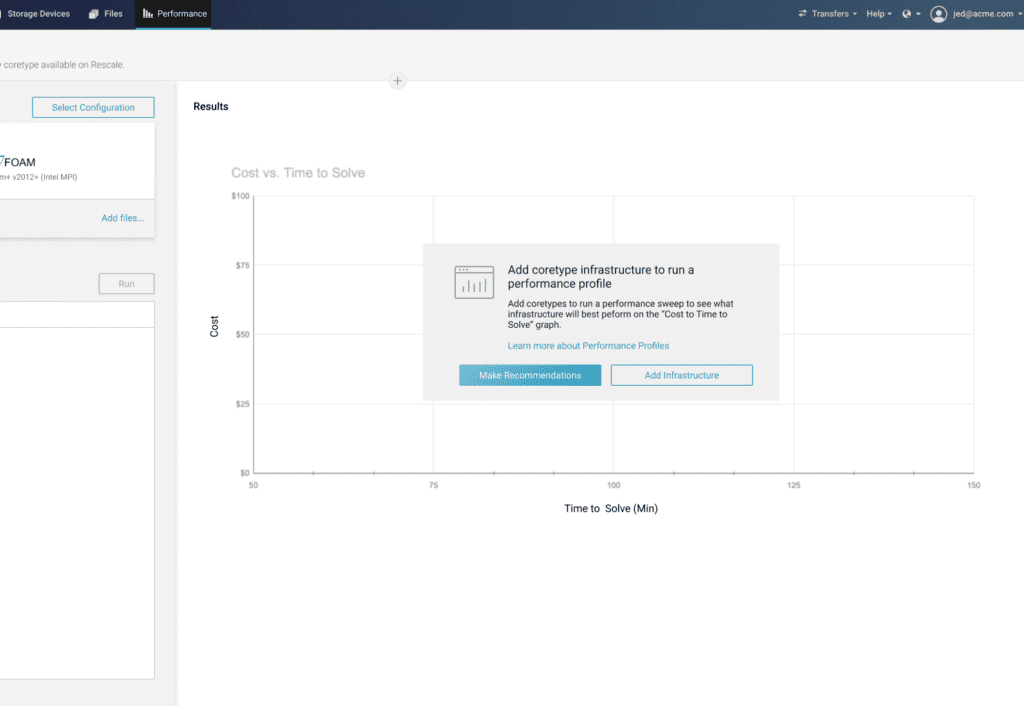
This feature allows you to save time and effort by automatically generating recommended hardware infrastructure to benchmark. By doing so, you can be confident that you are selecting the top hardware for your workload.
Determine Best Performing Hardware Infrastructure
After running your benchmarks, Performance Profiles will automatically determine the best hardware infrastructure using the following items: Balanced, Performance-Optimized, and Cost-Optimized.
With this feature, you can easily compare different hardware infrastructure options and choose the one that’s best suited to your needs. Whether you’re looking for a balanced solution, a performance-optimized solution, or a cost-optimized solution, Performance Profiles has you covered.
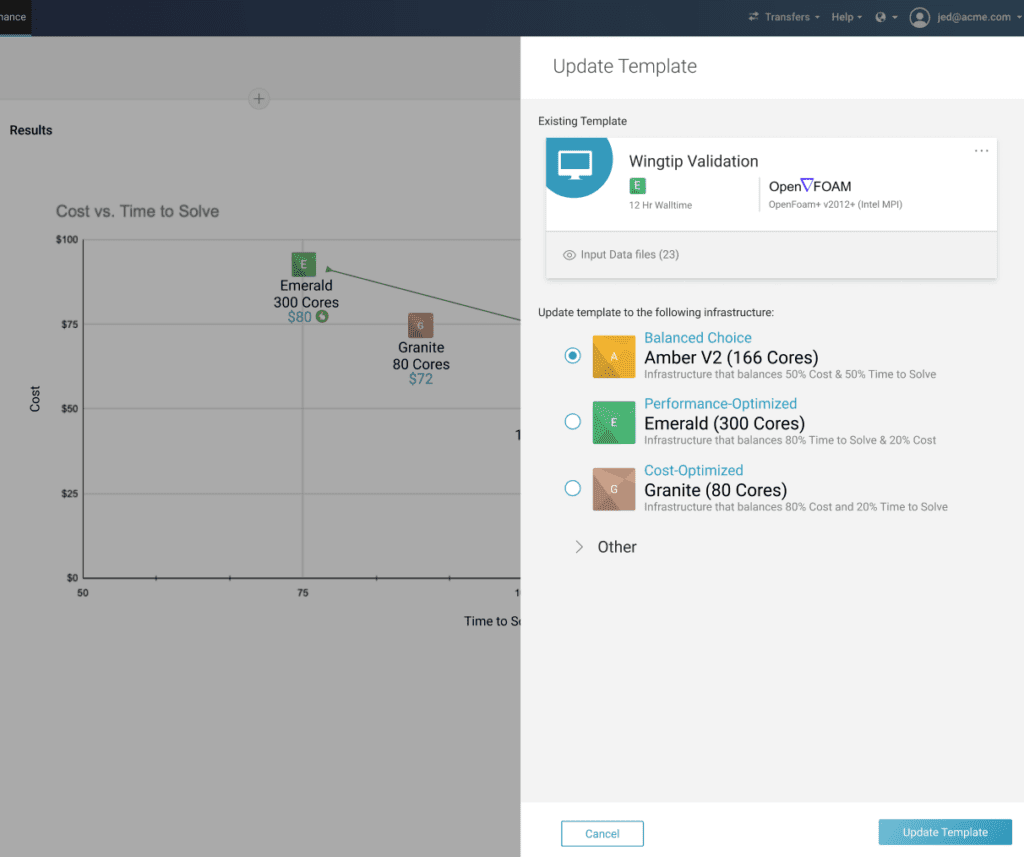
How the Recommendations Work
These recommendations are determined by evaluating each benchmark against each other on the cost and time data. Each of these data points is normalized against each other and then weighted based on the recommendation type to provide you with an ultimate recommendation.
| Recommendation Type | Logic |
| Balanced | Balanced infrastructure, weighting cost as 50%, and time to solve as 50% |
| Performance-Optimized | Skewed toward running your job faster, weights time to solve as 80% and cost as 20% |
| Cost-Optimized | Skewed toward running your job more economically, weights cost as 80% and time to solve as 20% |
FAQs
Is High-Performance Storage (HPS) supported?
No, HPS is not supported. HPS is only available in a single region and therefore is not a reliable solution with Performance Profiles.
Is there any way to make any tweaks to an individual benchmark configuration within a Performance Profile?
The Profile Configuration (Job or Template) locks in the same settings (software, software version, command, input files) in order to only change the hardware infrastructure as a variable. However, there are certain cases where you might have to tweak the command to run certain hardware or you would like to compare software versions.
In this case, before you run a Performance Profile Benchmark, you can click the hyperlink of the hardware name within the Hardware Benchmark Runs to open the job in a new tab. Once you do this, you will have the ability to modify all configurations within only that job.
Please note that if you do this, the data may be slightly skewed if you substantially change the job.